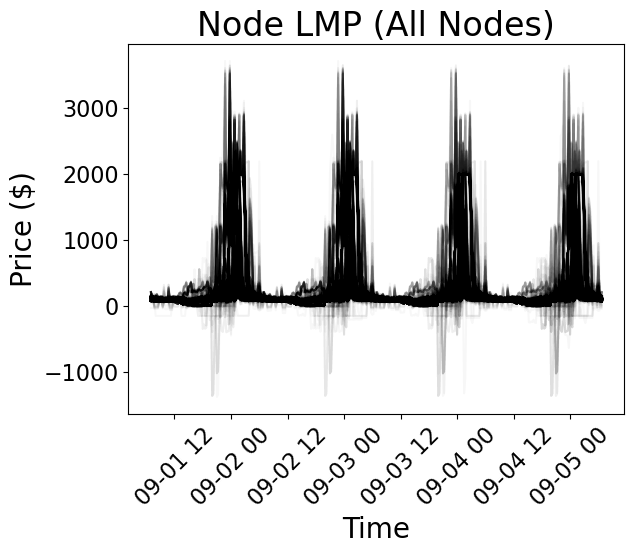
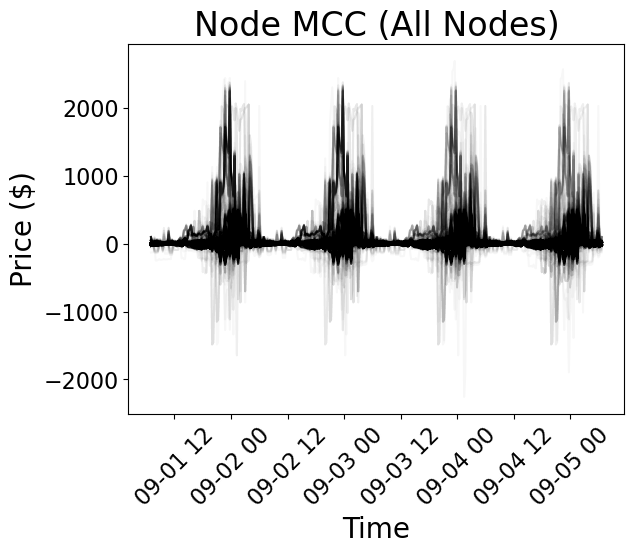
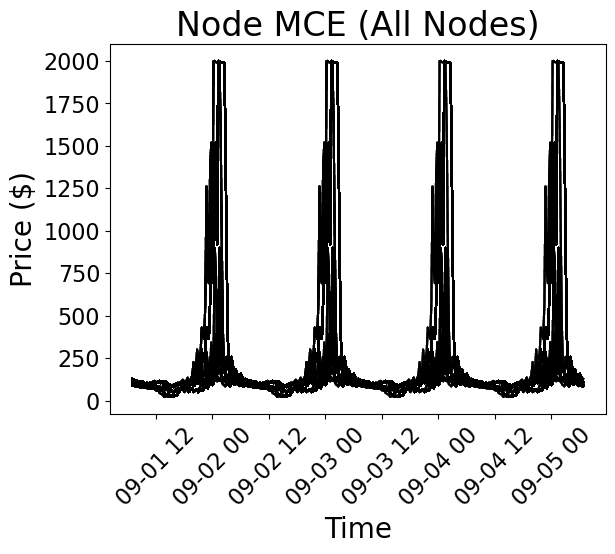
Understanding the states and evolution of power systems serves as one of the foundational modules of power systems. The major challenge in this context is the data sources are dispersed from system operators to utilities and independent organizations, while there is lack of an interactive visualization platform to integrate and present power system information along with geospatial features in an effective way. We propose GridViz, an open-source data analytics and visualization toolkit for efficient integration and analysis of multi-modal transmission grid data. By collecting and transforming different layers of data coming from ISOs, substations and OpenStreet map, and utilizing Geographic Information Systems (GIS), GridViz provides users an easy-to-use interface for analyzing time-series data as well as geographical insights regarding power grid operations. We demonstrate GridViz can help enhance grid situational awareness for a wide of targeted users ranging from engineers to market operators and electricity energy end users. Our visualization tools can produce grid visualization which are easily viewable, editable, repeatable and can be produced as animations, and such methods can be served as backbones for a range of tasks such as grid marginal carbon emissions and contingencies analysis.